Visual Guide: TIATON Management UI
One of the questions we hear most often: "What does the runtime actually look like when it's running?" Fair question. Decision engines are abstract by nature — rules, predicates, state machines. But operating one shouldn't require reading logs in a terminal.
This article walks through the TIATON management UI — the interface operators and analysts use day-to-day to author rules, inspect workflows, and debug live sessions.
Decision Tables
At the heart of TIATON's rule engine are DMN decision tables. Each table maps input conditions to output values using a familiar spreadsheet-like format.
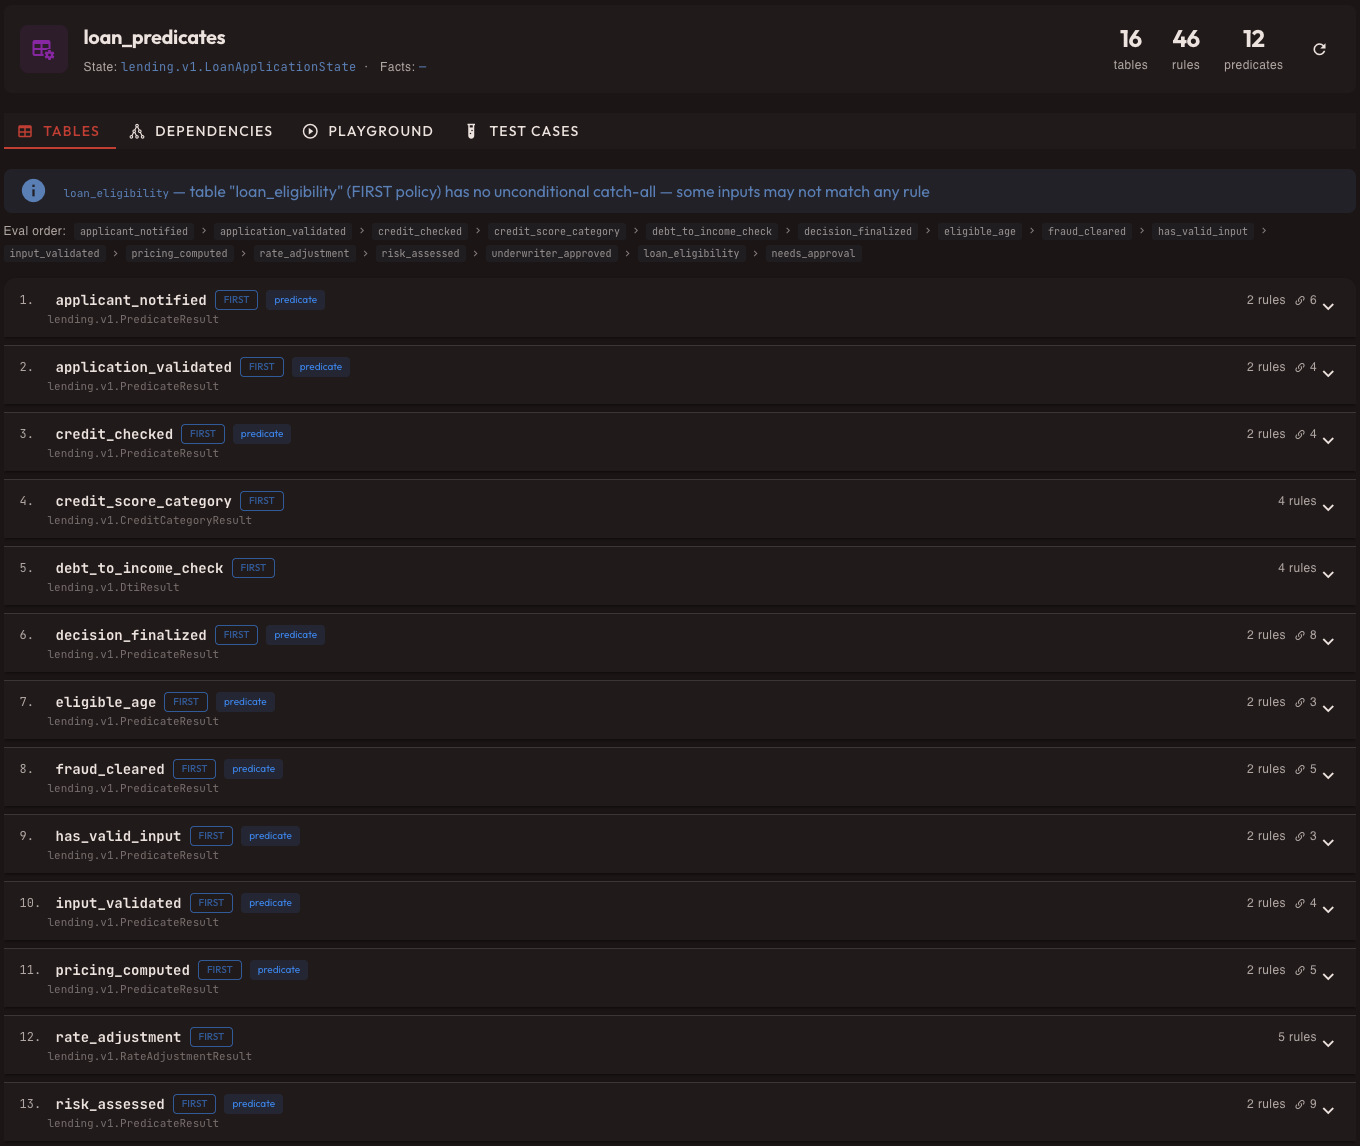
The table view shows every rule in context. Columns represent input conditions (left) and output values (right). The NOTE column on the far right lets analysts annotate rules with business justification — a small feature that saves hours during audits.
Inspecting Individual Rules
Click any row to drill into its details:
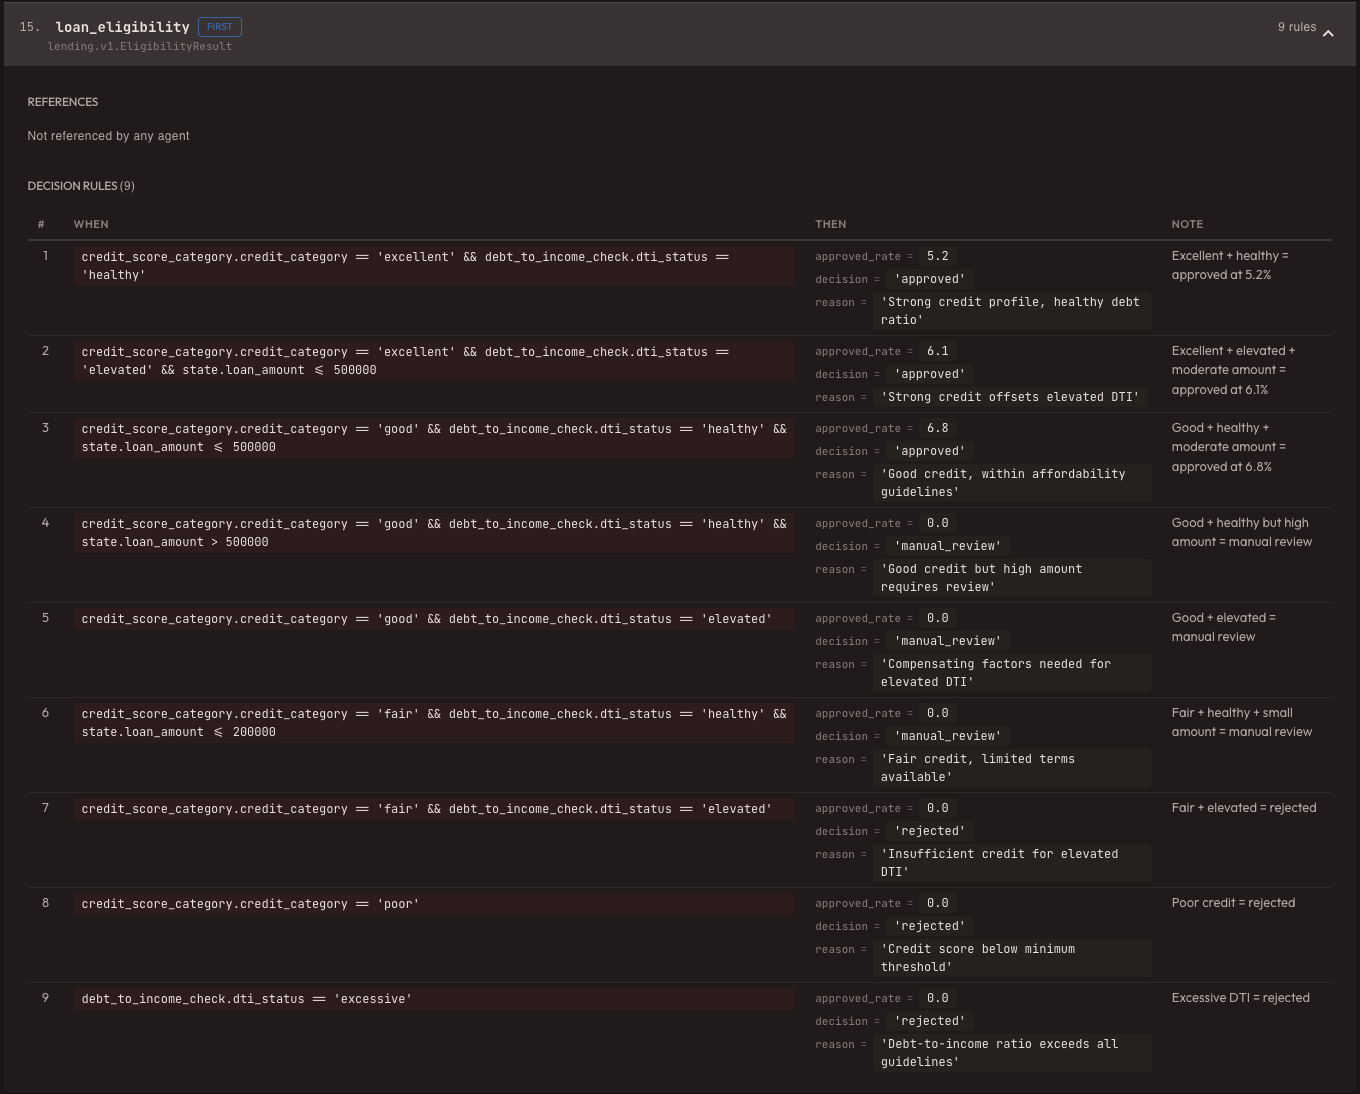
The detail panel shows the exact conditions and output for a single rule. This is where analysts verify that a specific scenario produces the expected result — before deploying to production.
Dependency Tracking
Decision tables don't exist in isolation. One table's output often feeds into another. The dependency tab shows this graph:
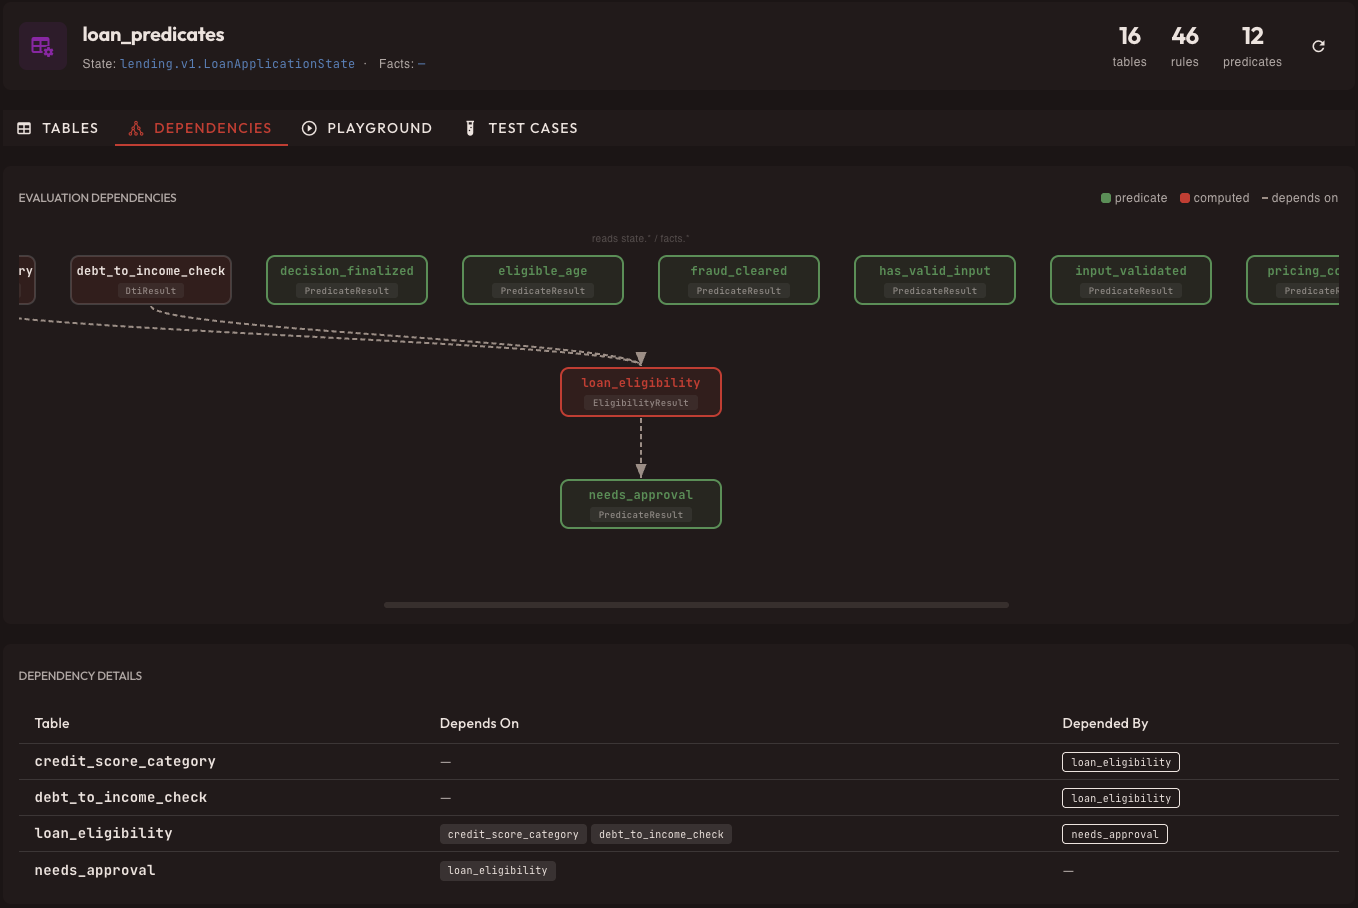
This view answers the critical question: "If I change table X, what else is affected?" The graph is computed automatically from the table definitions.
The Playground
Testing rules shouldn't require deploying them. The playground lets you evaluate any scenario interactively:
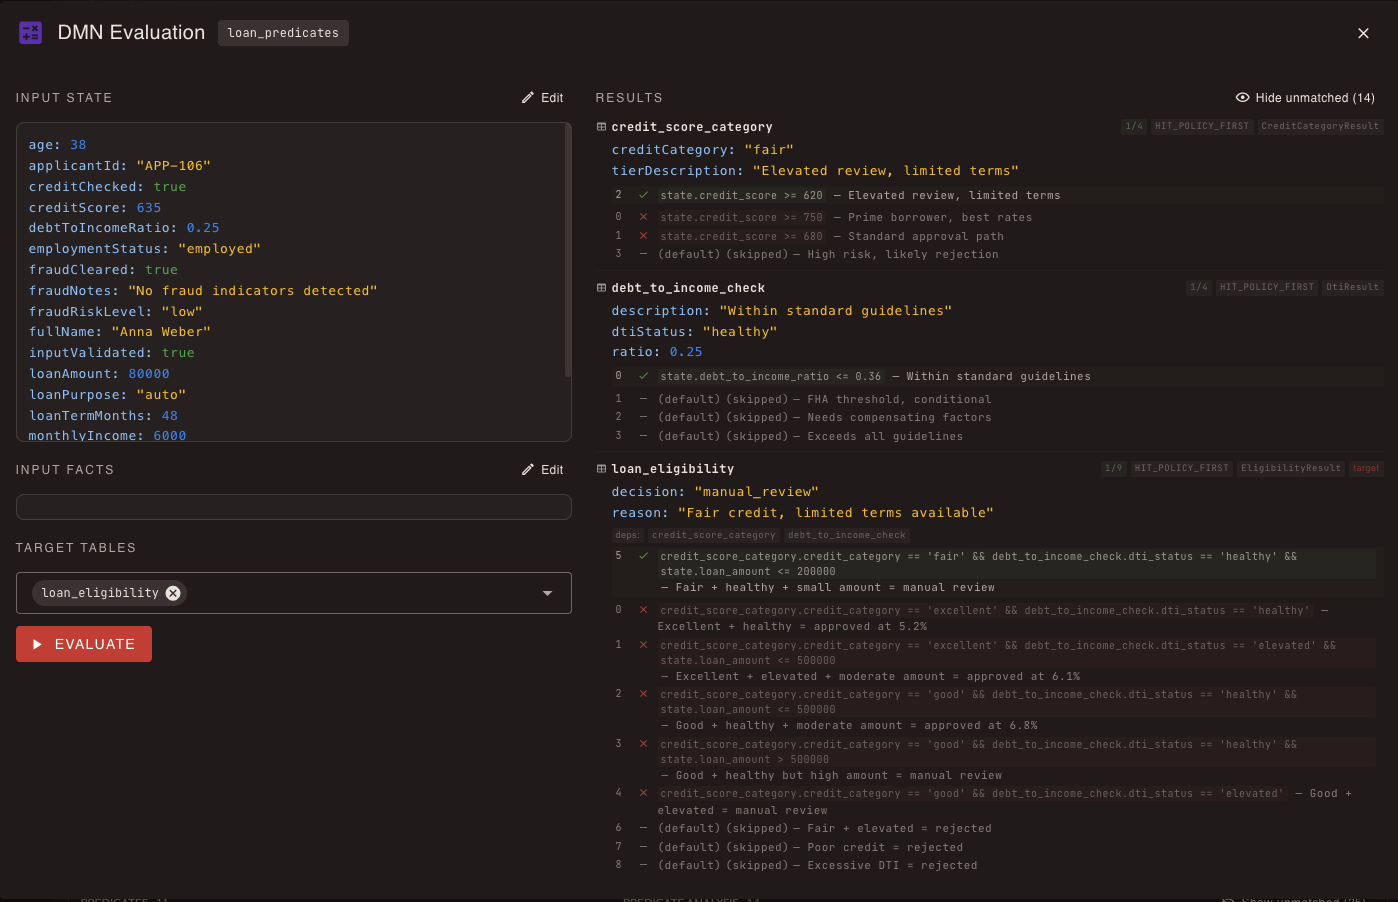
Enter your test inputs, hit Evaluate, and see exactly which rules fired, in what order, and what outputs they produced. The in-depth analysis section below breaks down the evaluation step by step — invaluable for debugging complex multi-table chains.
Agent Workflows
TIATON's agent system orchestrates multi-step workflows using a goal-directed approach. Each skill declares what it needs (prerequisites) and what it guarantees (postconditions).
Skill Definitions
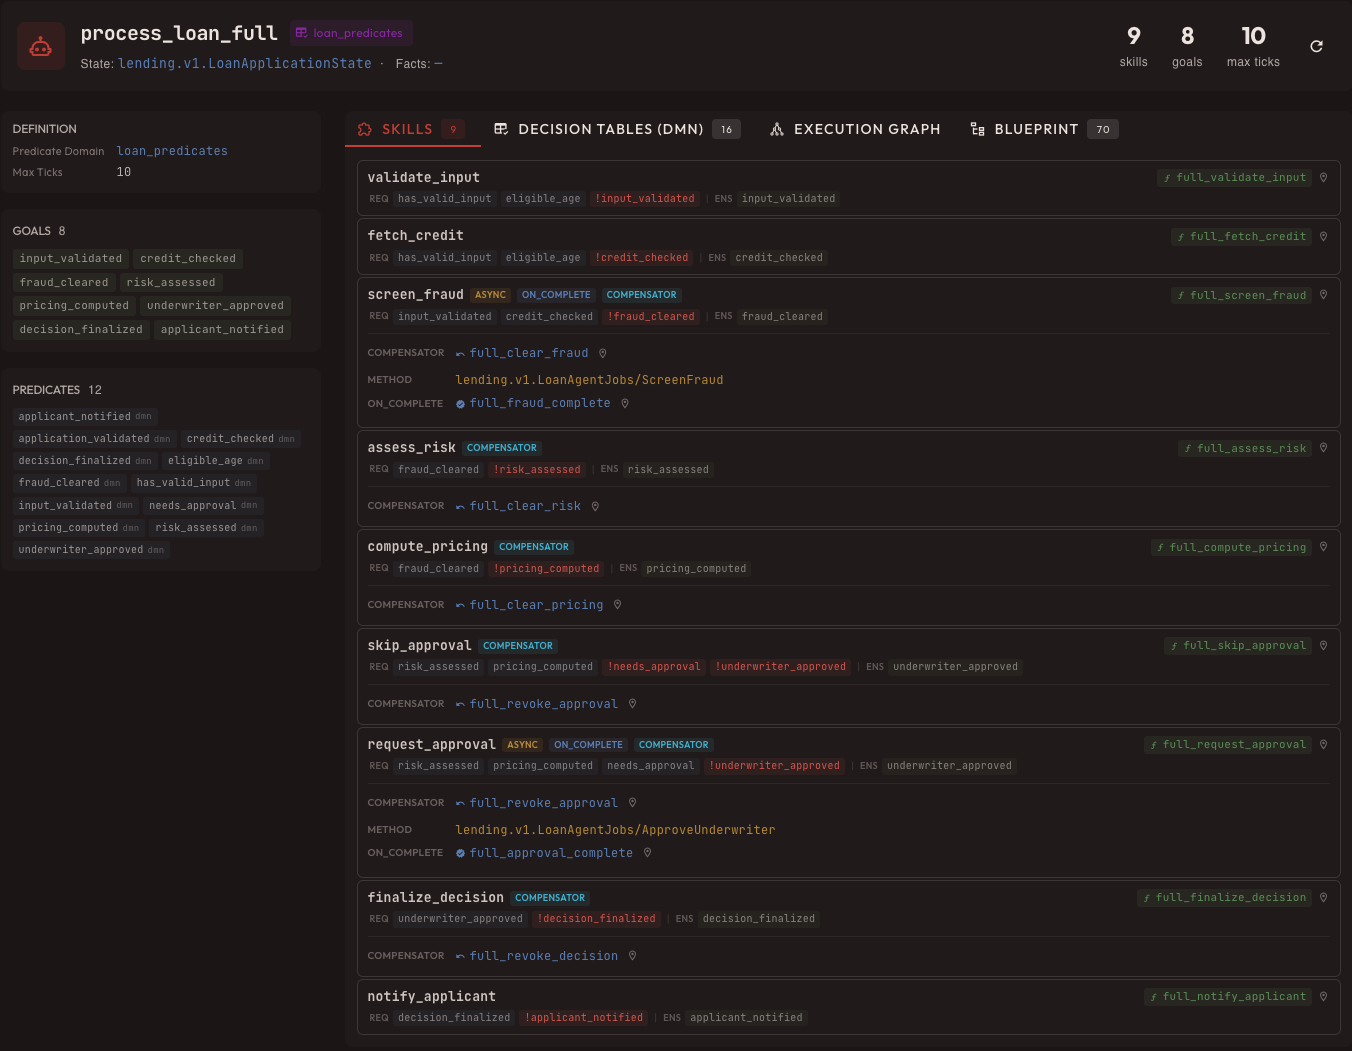
Each skill definition is a contract: "I require these conditions, I ensure these outcomes, and if I fail, here's how to compensate." This declarative approach means the engine can reason about execution order automatically.
Execution Graph
The execution graph shows how skills relate to each other at design time:
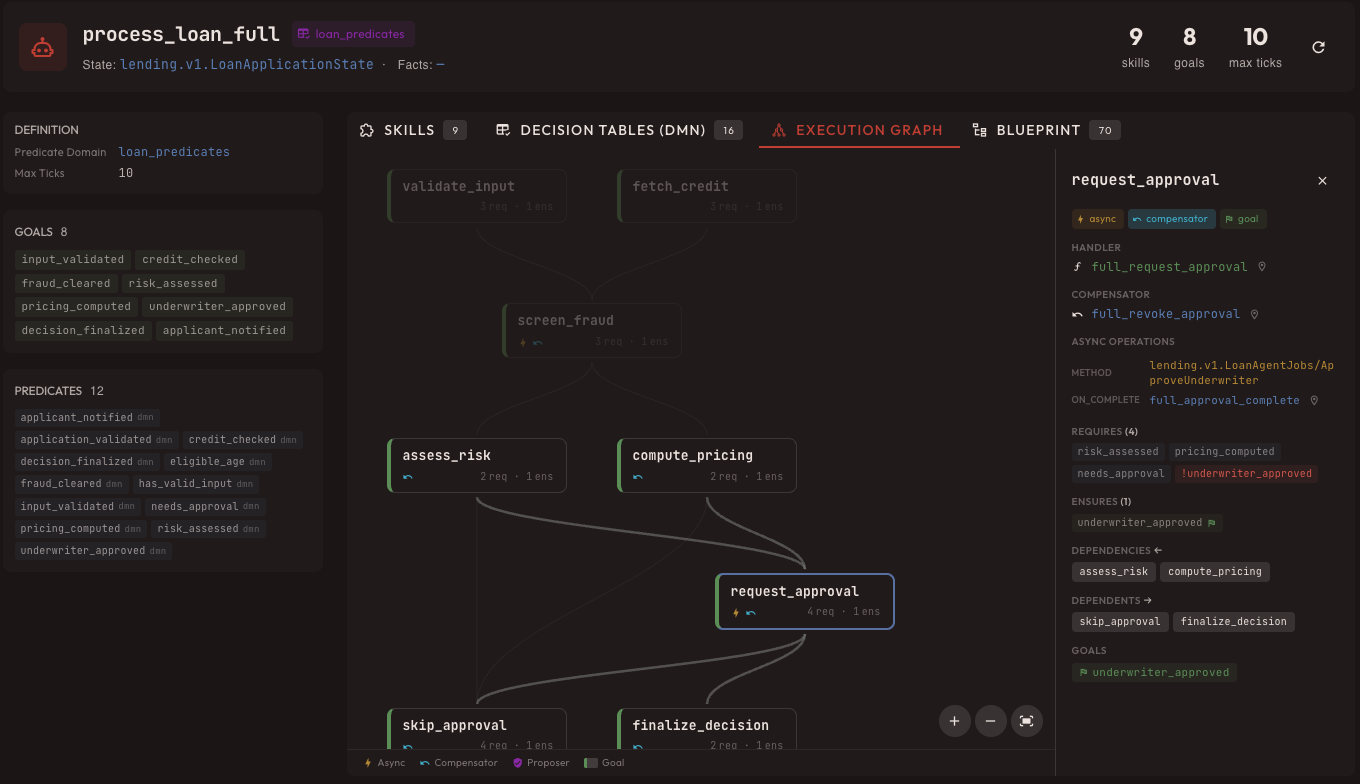
This is a design-time view — it shows the potential execution paths before any session starts. Compare this with the runtime views below to see the difference between "what could happen" and "what actually happened."
Session Observability
When a workflow runs, every tick is recorded. The session page gives you full observability into what happened and why.
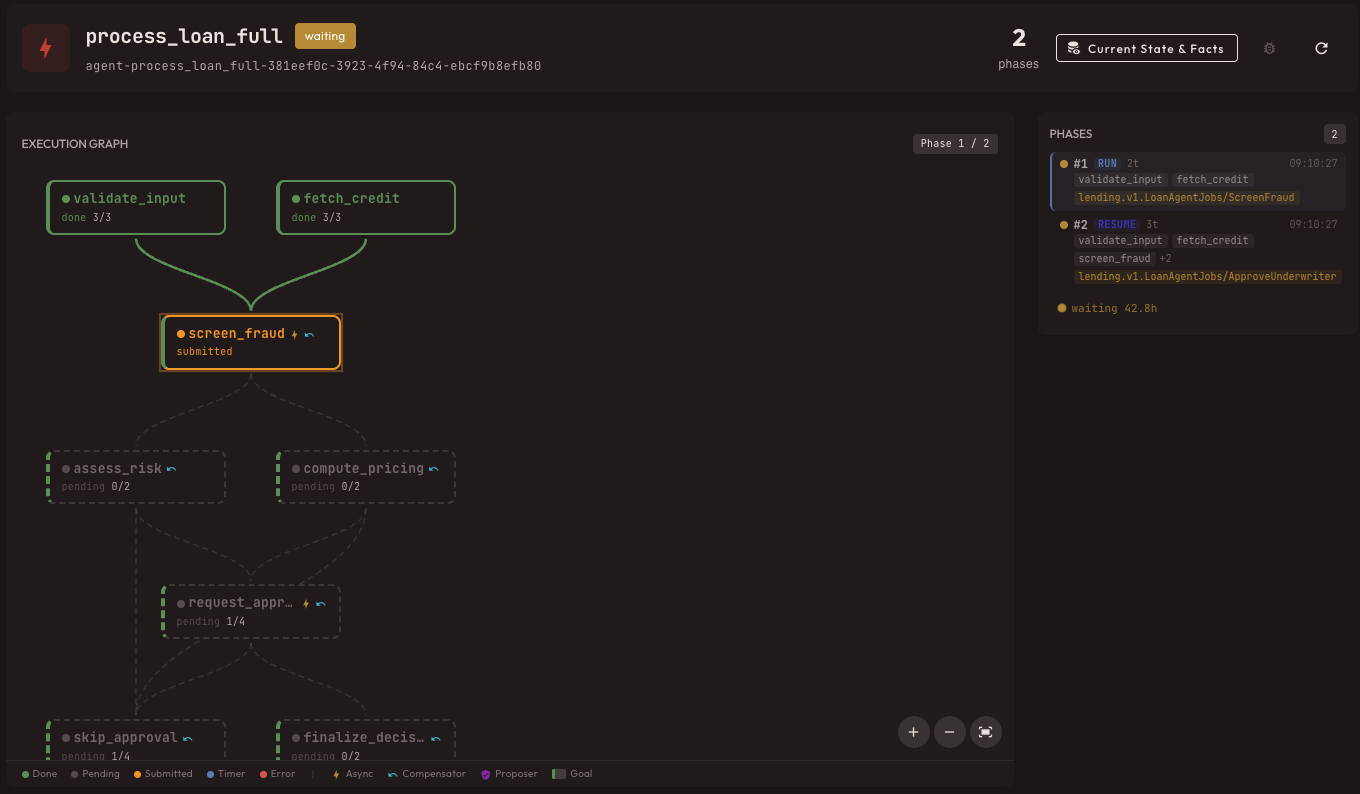
Live Execution Status
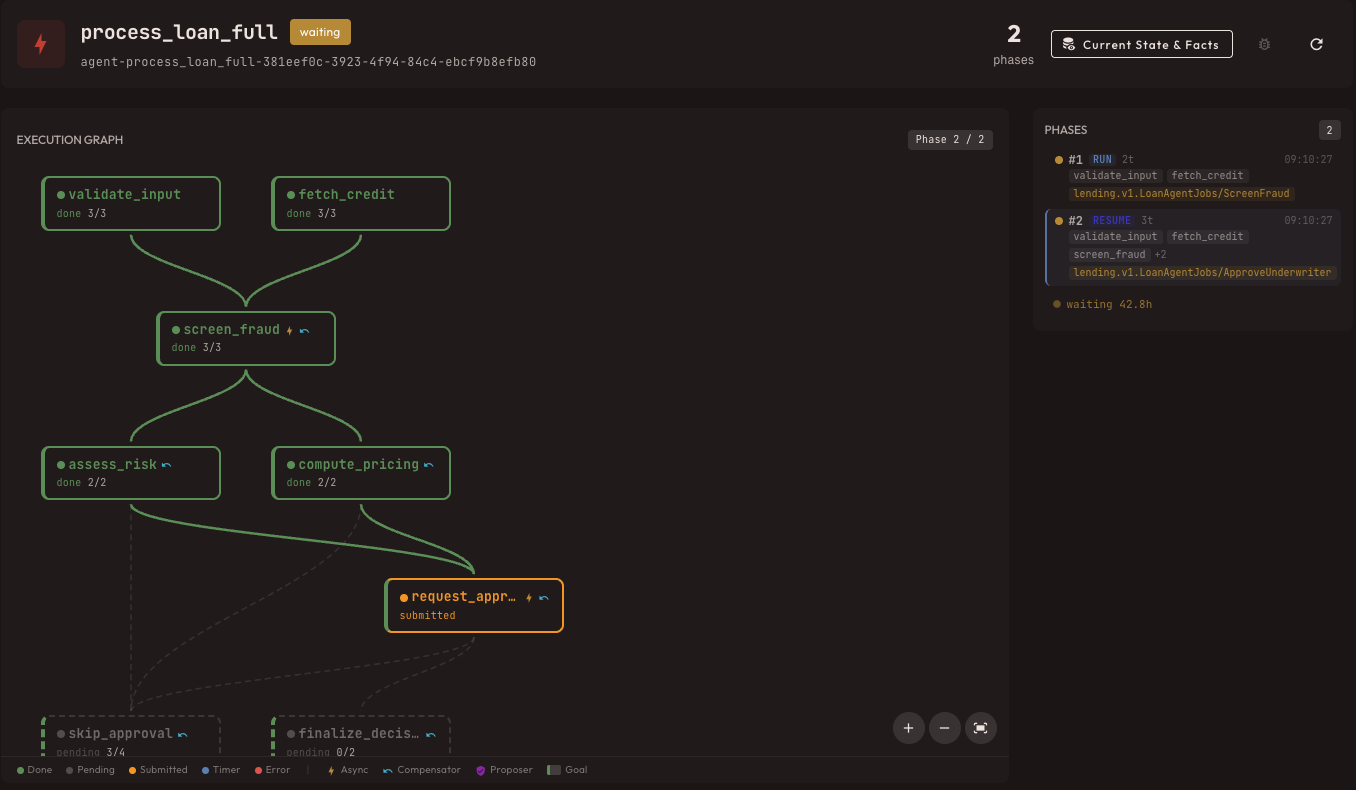
The execution graph is now annotated with runtime status. Green nodes succeeded, yellow are waiting, red failed. The phase timeline at the top shows the chronological progression — in this case, a session that's been waiting for 42.8 hours on an external approval.
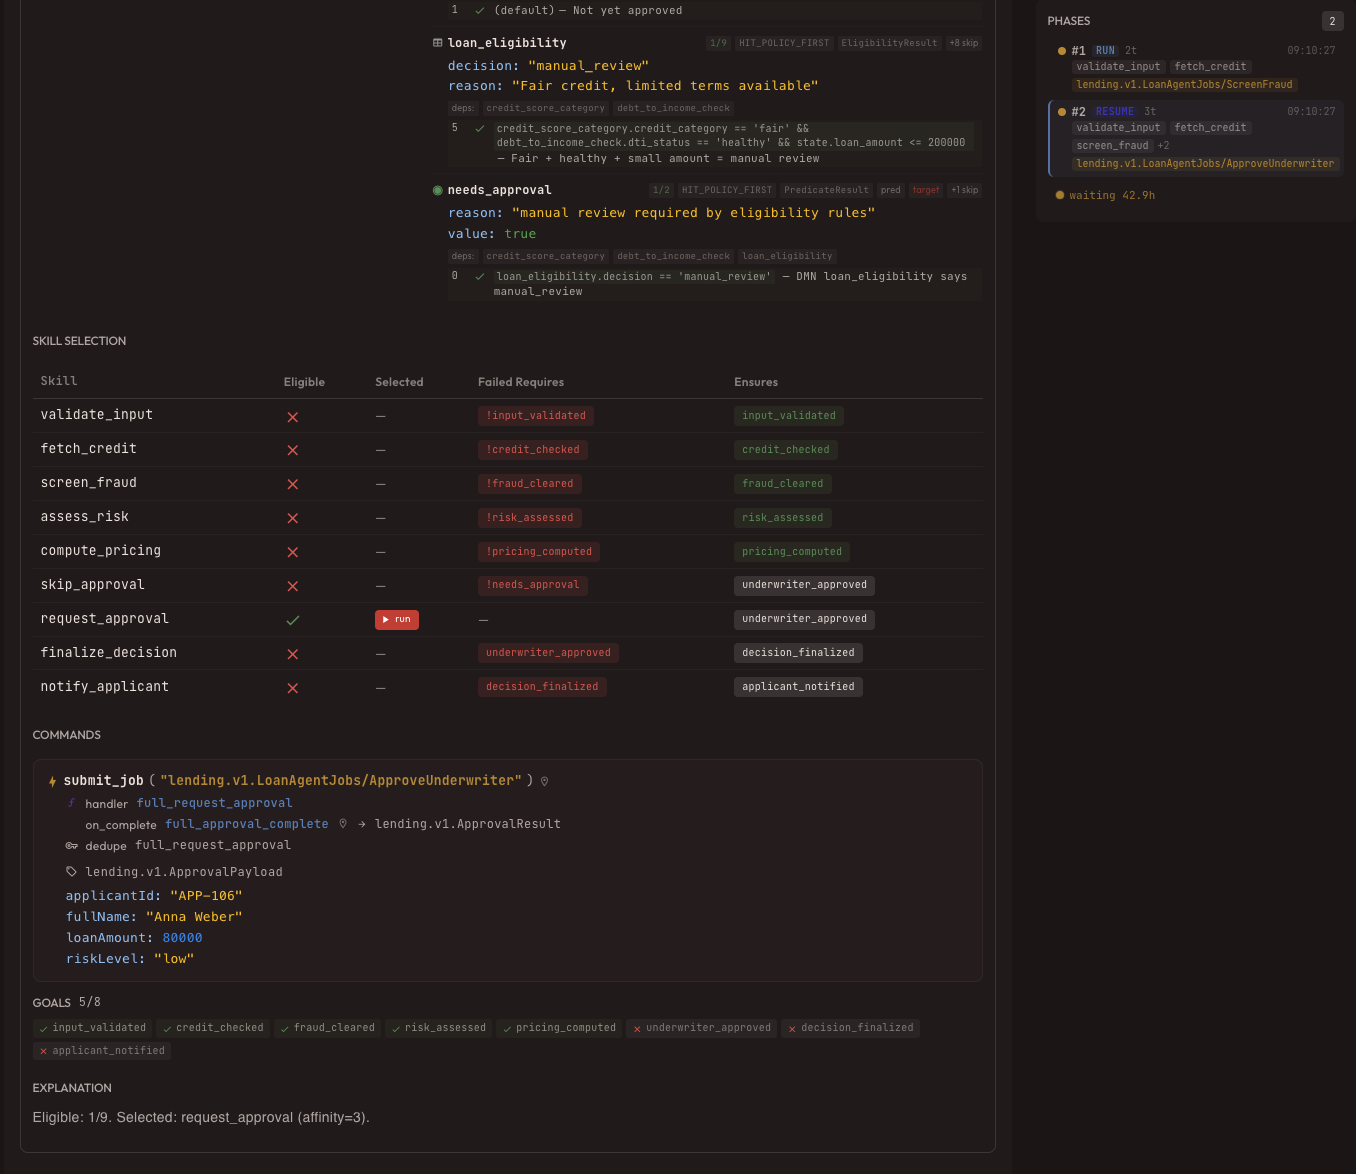
Decision Trace
Click any node to see exactly why the engine made that decision:
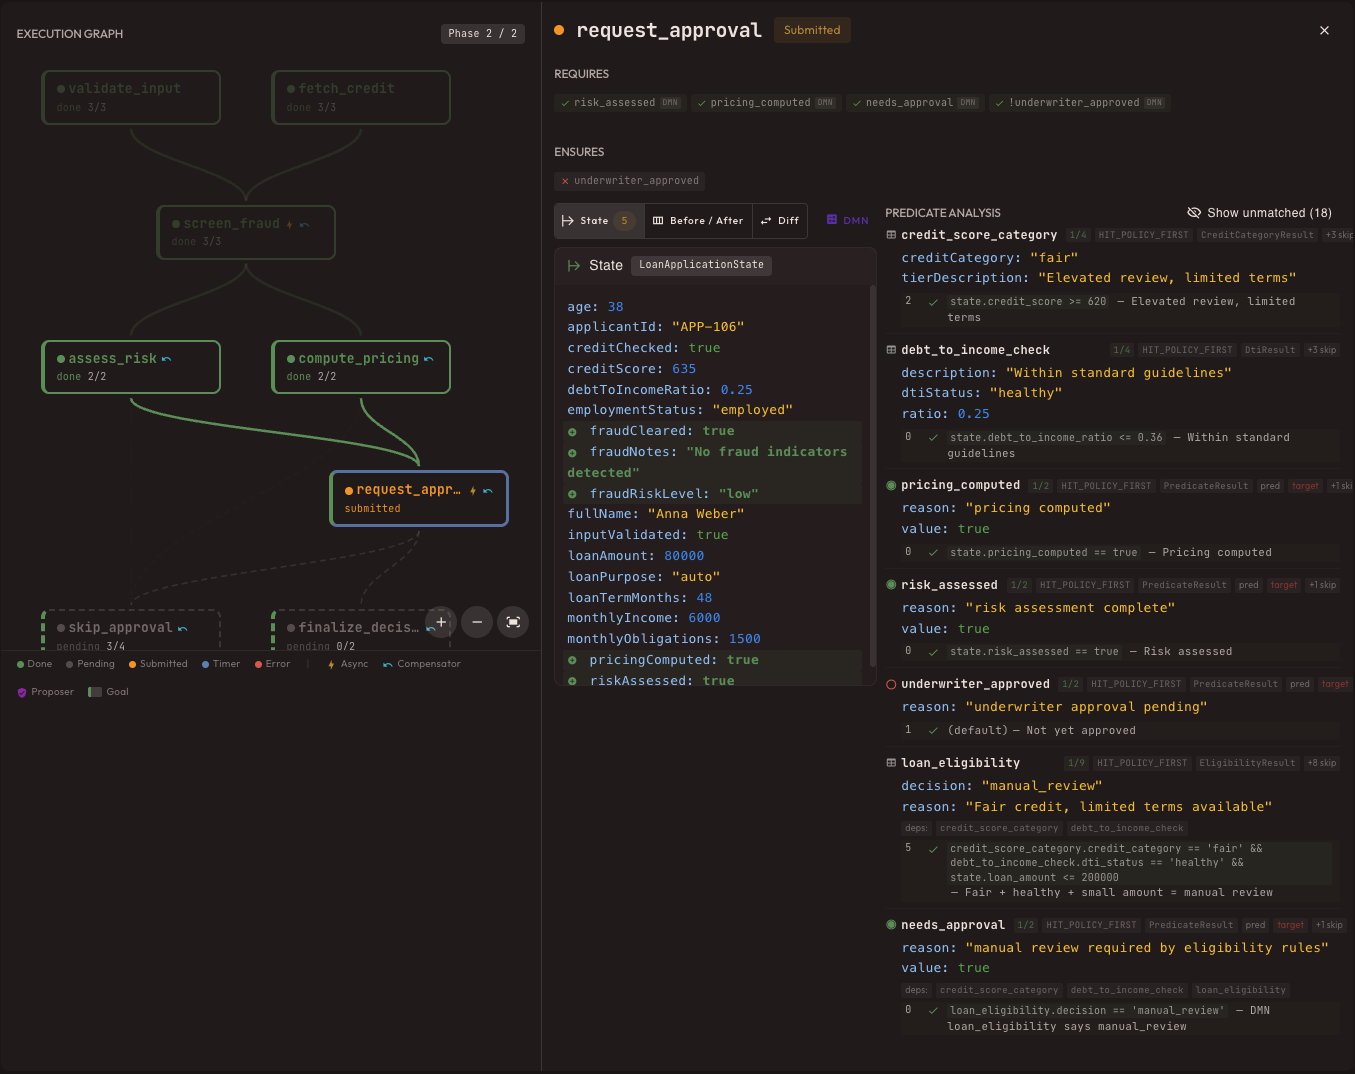
This is the money shot for debugging. You can see which predicates evaluated to true, which skills were eligible, and why the engine chose the one it did. Every decision is traceable back to specific rule evaluations.
Phase Details
Each phase of execution can be expanded to show individual ticks:
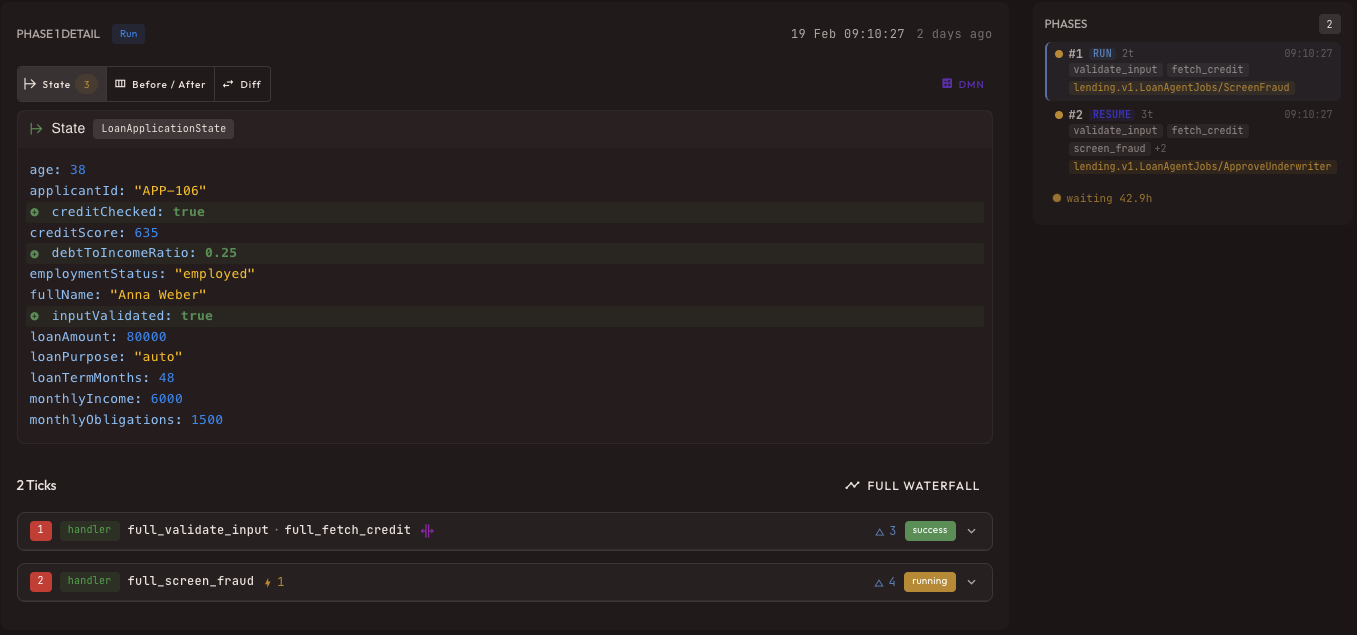
The expanded tick view shows everything that happened in a single engine cycle: which predicates were evaluated, which skill was selected, what state changes occurred, and how long each step took.
Timeline Navigation
For long-running sessions, the timeline lets you jump to any phase:
Error Recovery
When things go wrong, TIATON's compensation system kicks in automatically:
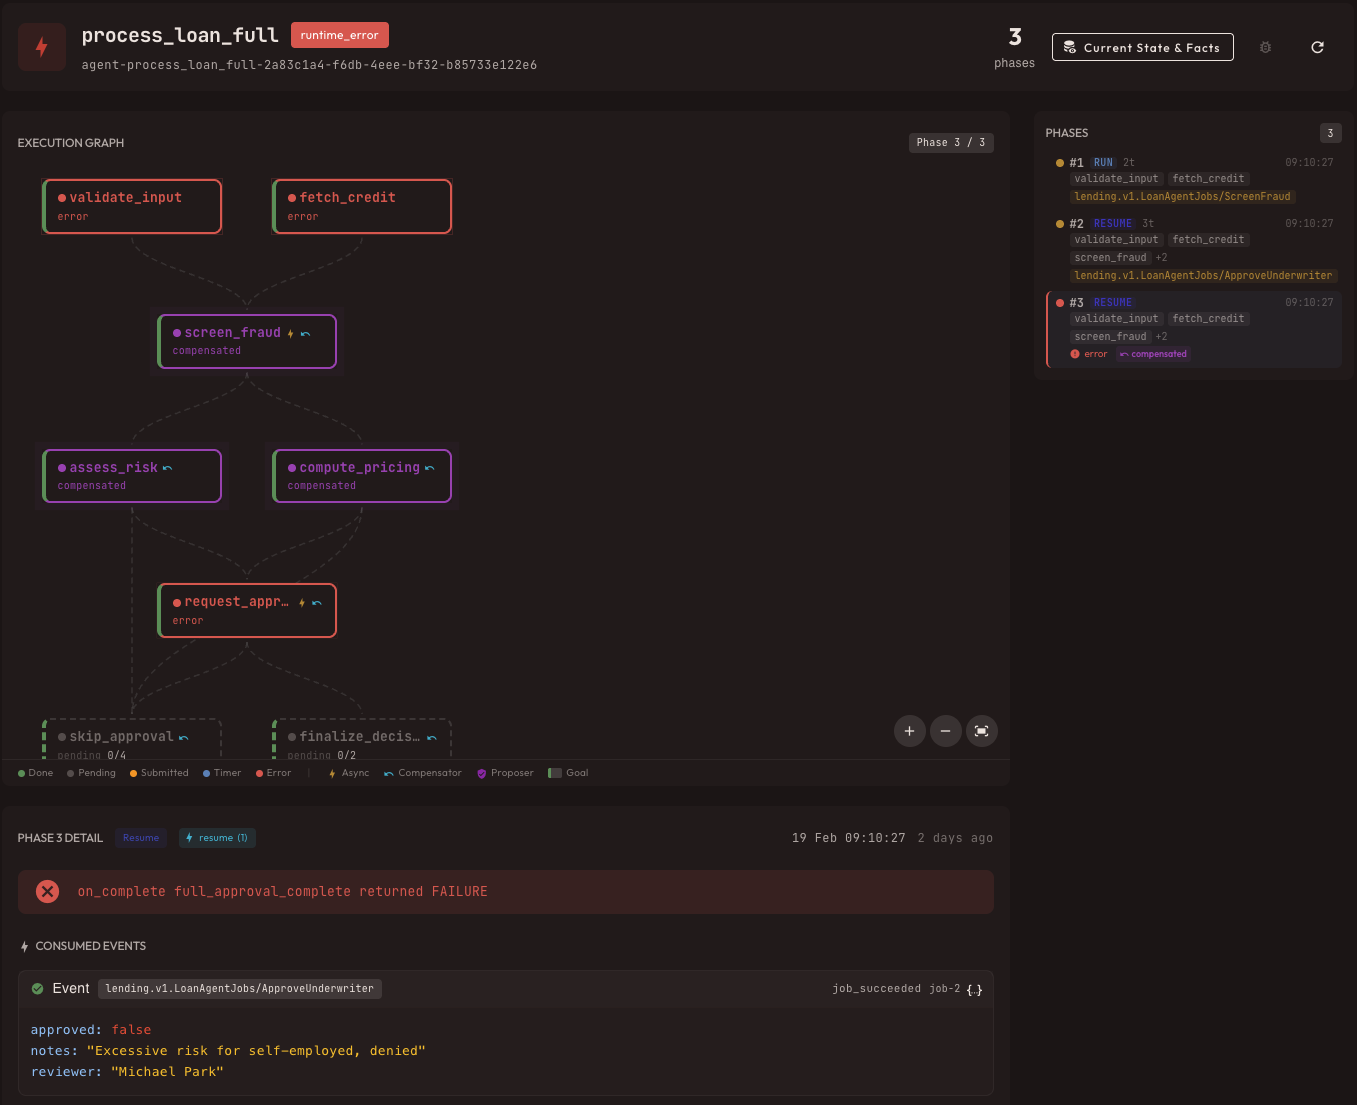
This session shows a failure mid-workflow. The engine automatically triggered compensation for previously completed skills (marked in orange). The full error is captured in the event log on the right — no log diving required.
Session List
The session list page gives operators a bird's-eye view of all running and completed sessions:
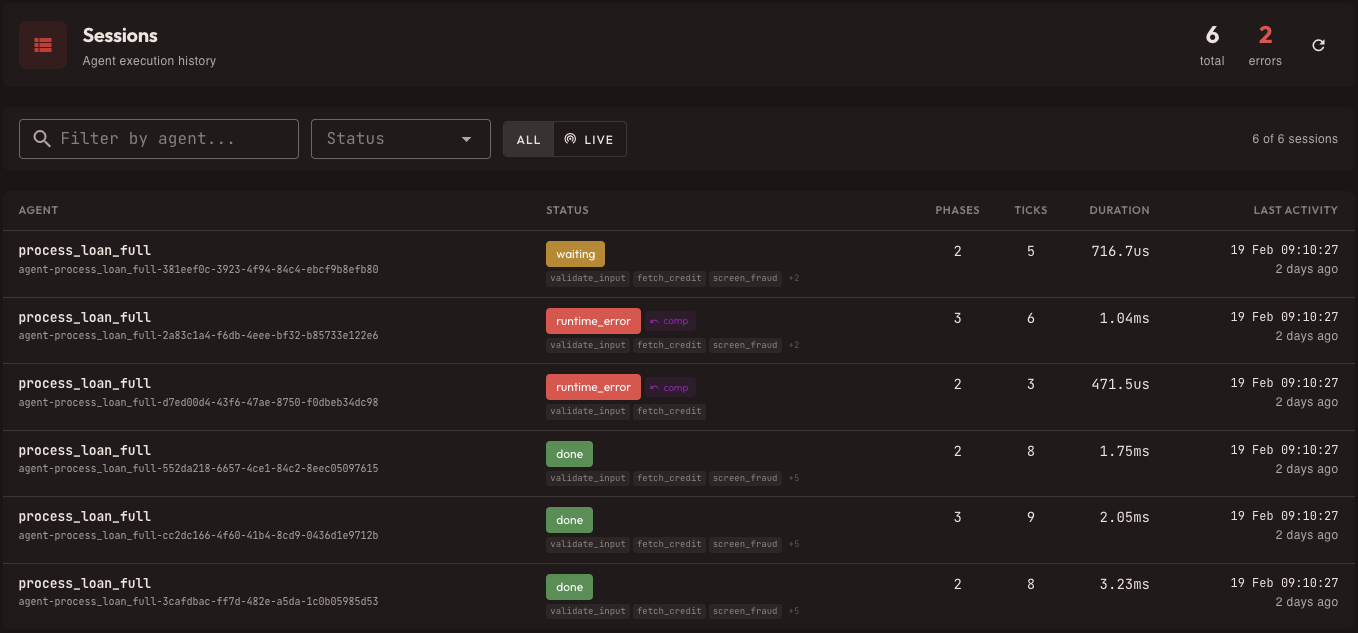
Filter by status, sort by time, and click through to any session for the full trace. This is the starting point for most operational workflows — "what's running right now?" and "what failed overnight?"
Writing Articles with Images
For those writing blog content on this site, here's how images work in markdown:

The caption is generated automatically from the alt text. Images are clickable — click any screenshot above to see the full-resolution version in a lightbox overlay.
You can place images anywhere in the flow of your article. They'll be wrapped in a <figure> element with a <figcaption> automatically. No extra HTML needed.
Summary
The management UI is designed around one principle: every decision should be explainable. From the rule table to the session trace, every step in the chain is visible, searchable, and auditable.
| Feature | What it shows |
|---|---|
| Decision Tables | Rule definitions with annotations |
| Dependency Graph | Cross-table data flow |
| Playground | Interactive rule evaluation |
| Skill Definitions | Handler contracts and compensation |
| Execution Graph | Design-time workflow visualization |
| Session Timeline | Runtime phase progression |
| Decision Trace | Per-node reasoning and predicate values |
| Error Recovery | Automatic compensation with full audit |
The goal isn't just to run business rules — it's to run them in a way that anyone on the team can understand what happened and why.